Diagnostic Imaging Quick Filters
To generate a Diagnostic Imaging Quick Filter report:
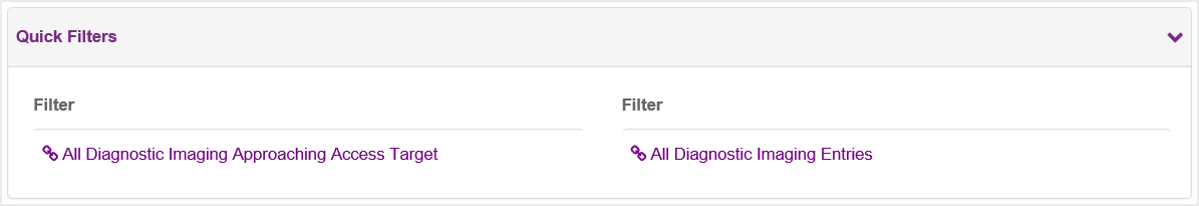
- Select one of the available DI Quick Filters from the WTIS Home page:
|
Filter |
Description |
|
All Diagnostic Imaging Entries Approaching Access Target |
Displays all open MRI/CT waitlist entries for patients that have waited at least 80% or more of the Access Target (based on the priority level). |
|
All Diagnostic Imaging Entries |
Displays all open MRI/CT waitlist entries. |
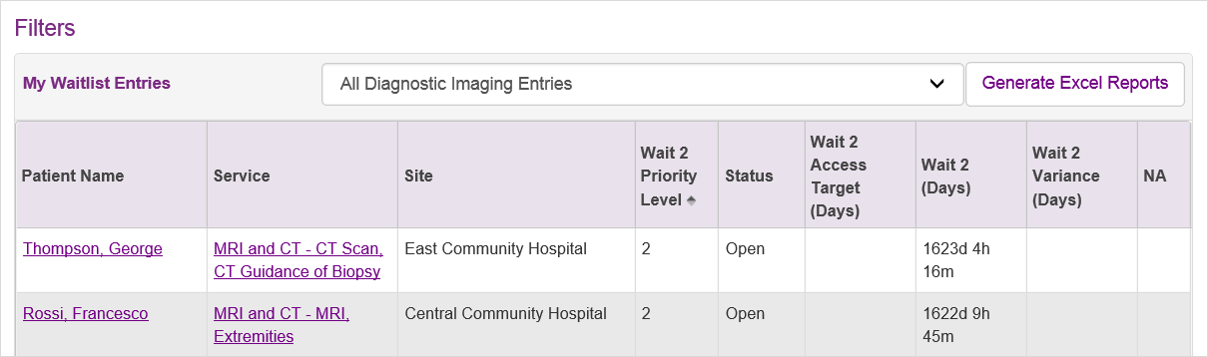
- The Quick Filter report displays the following columns of information:
| Column | Description |
|
Patient Name |
Patient’s first, middle and last names |
|
Service |
Diagnostic type and MRI/CT service |
|
Site |
Site name |
|
Wait 2 Priority Level |
Priority level of the patient |
|
Status |
Current status of the waitlist entry; including:
|
|
Access Target (Days) |
Maximum recommended wait time for the associated service and priority level |
|
Wait 2 (Days) |
Total number of days, hours and minutes the patient has been waiting for the service as of the current date |
|
Variance (Days) |
The difference between the patient’s current wait time and the defined Access Target for the procedure based on the assigned priority (a negative variance displays in red with brackets).
Note: The MRI/CT variance calculation includes days, hours and minutes. |
|
NA |
Displays a flag |
| Tip: Click the relevant column heading once to sort in ascending order or twice to sort in descending order. |
To generate an Excel report from Quick Filters, click the Generate Excel Reports button.
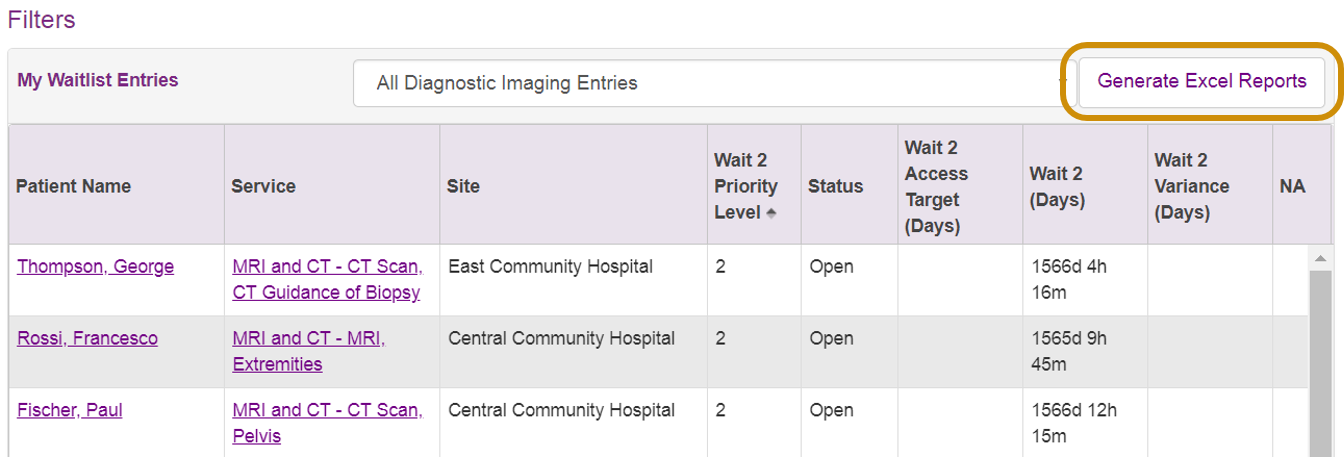
| Note: For WTIS data extraction and reporting functions, you will require at least Microsoft Excel 2003, Service Pack 1 (required for data extraction and reporting functions). Refer to the WTIS Minimum System Requirements for more details. |